
Description
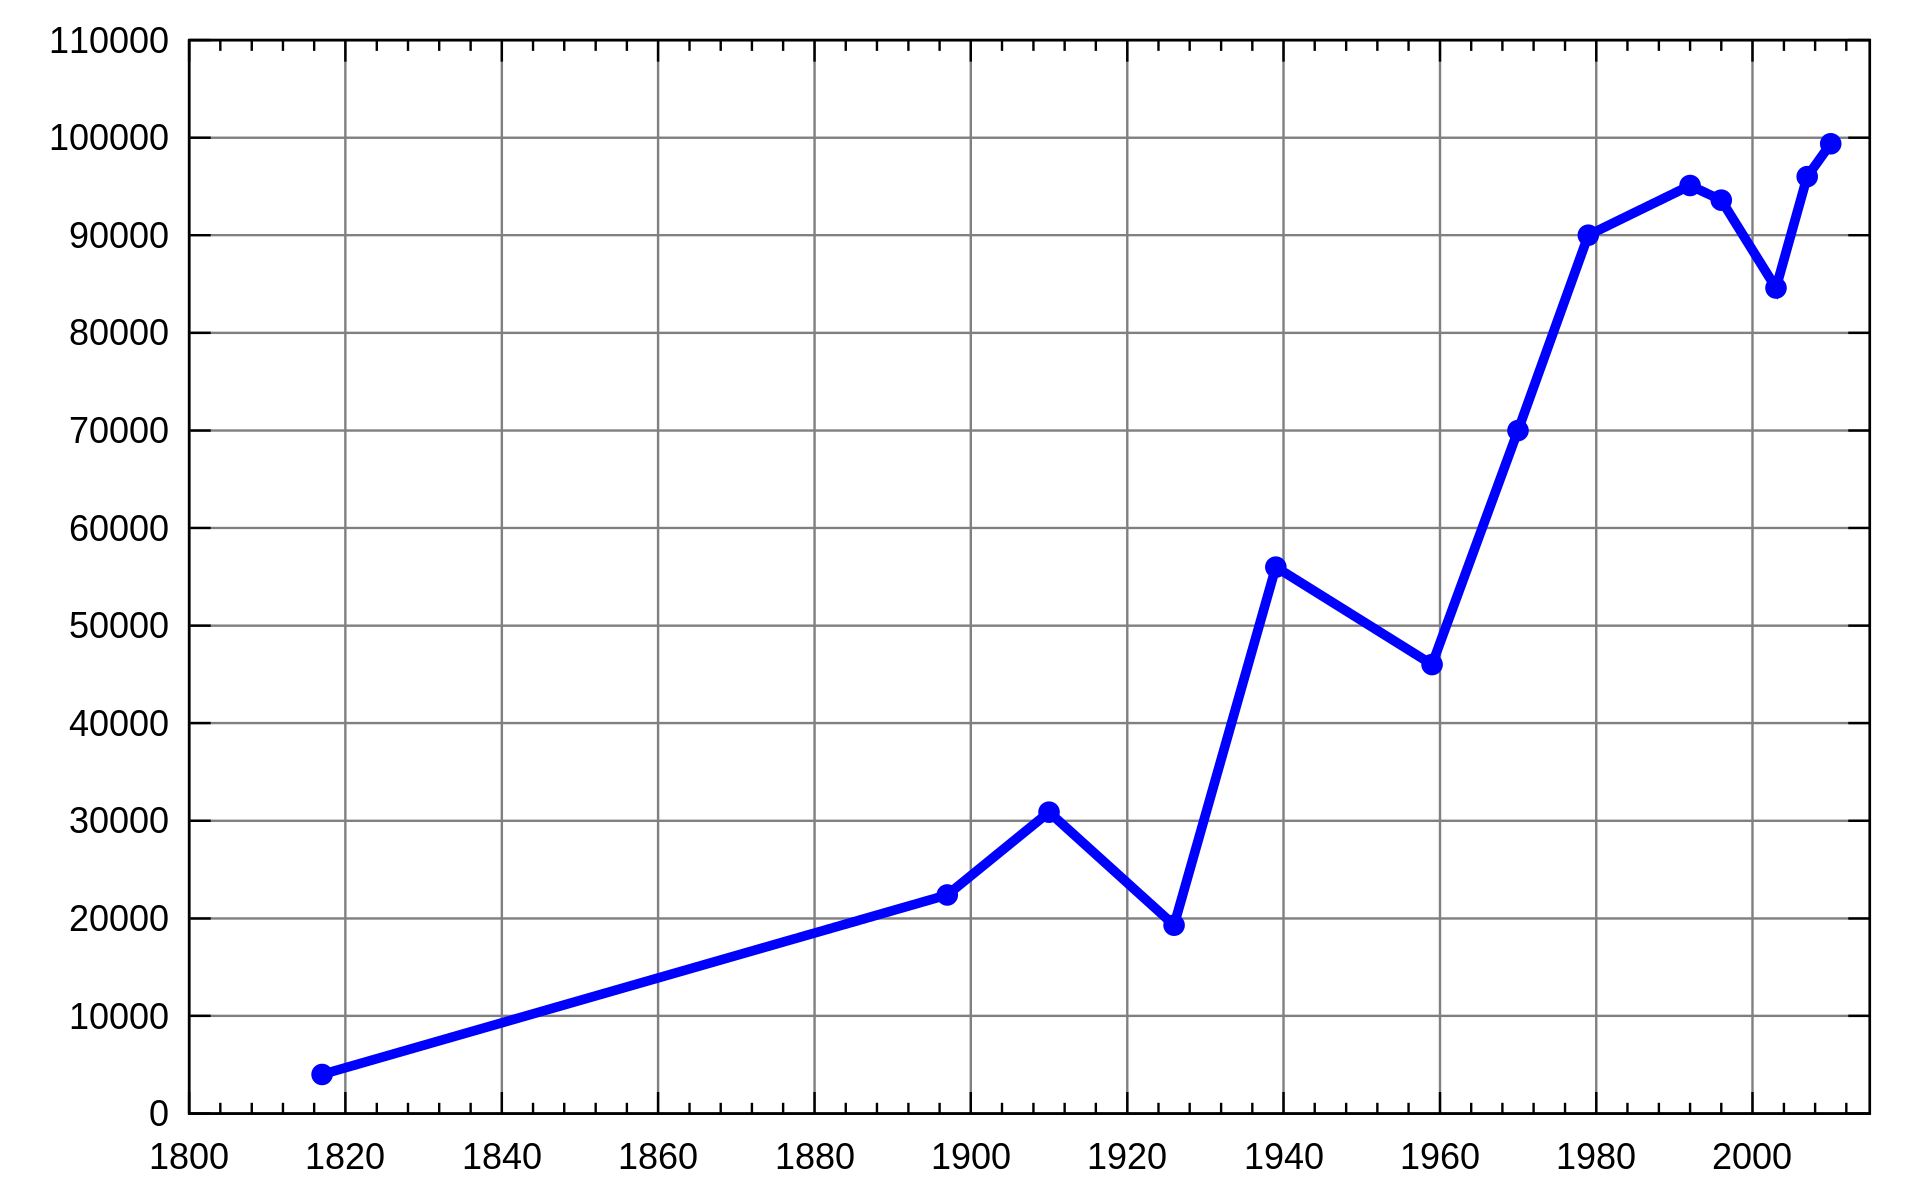
You are given a 2D integer array stockPrices where stockPrices[i] = [dayi, pricei] indicates the price of the stock on day dayi is pricei. A line chart is created from the array by plotting the points on an XY plane with the X-axis representing the day and the Y-axis representing the price and connecting adjacent points. One such example is shown below:
Return the minimum number of lines needed to represent the line chart.
Example 1:
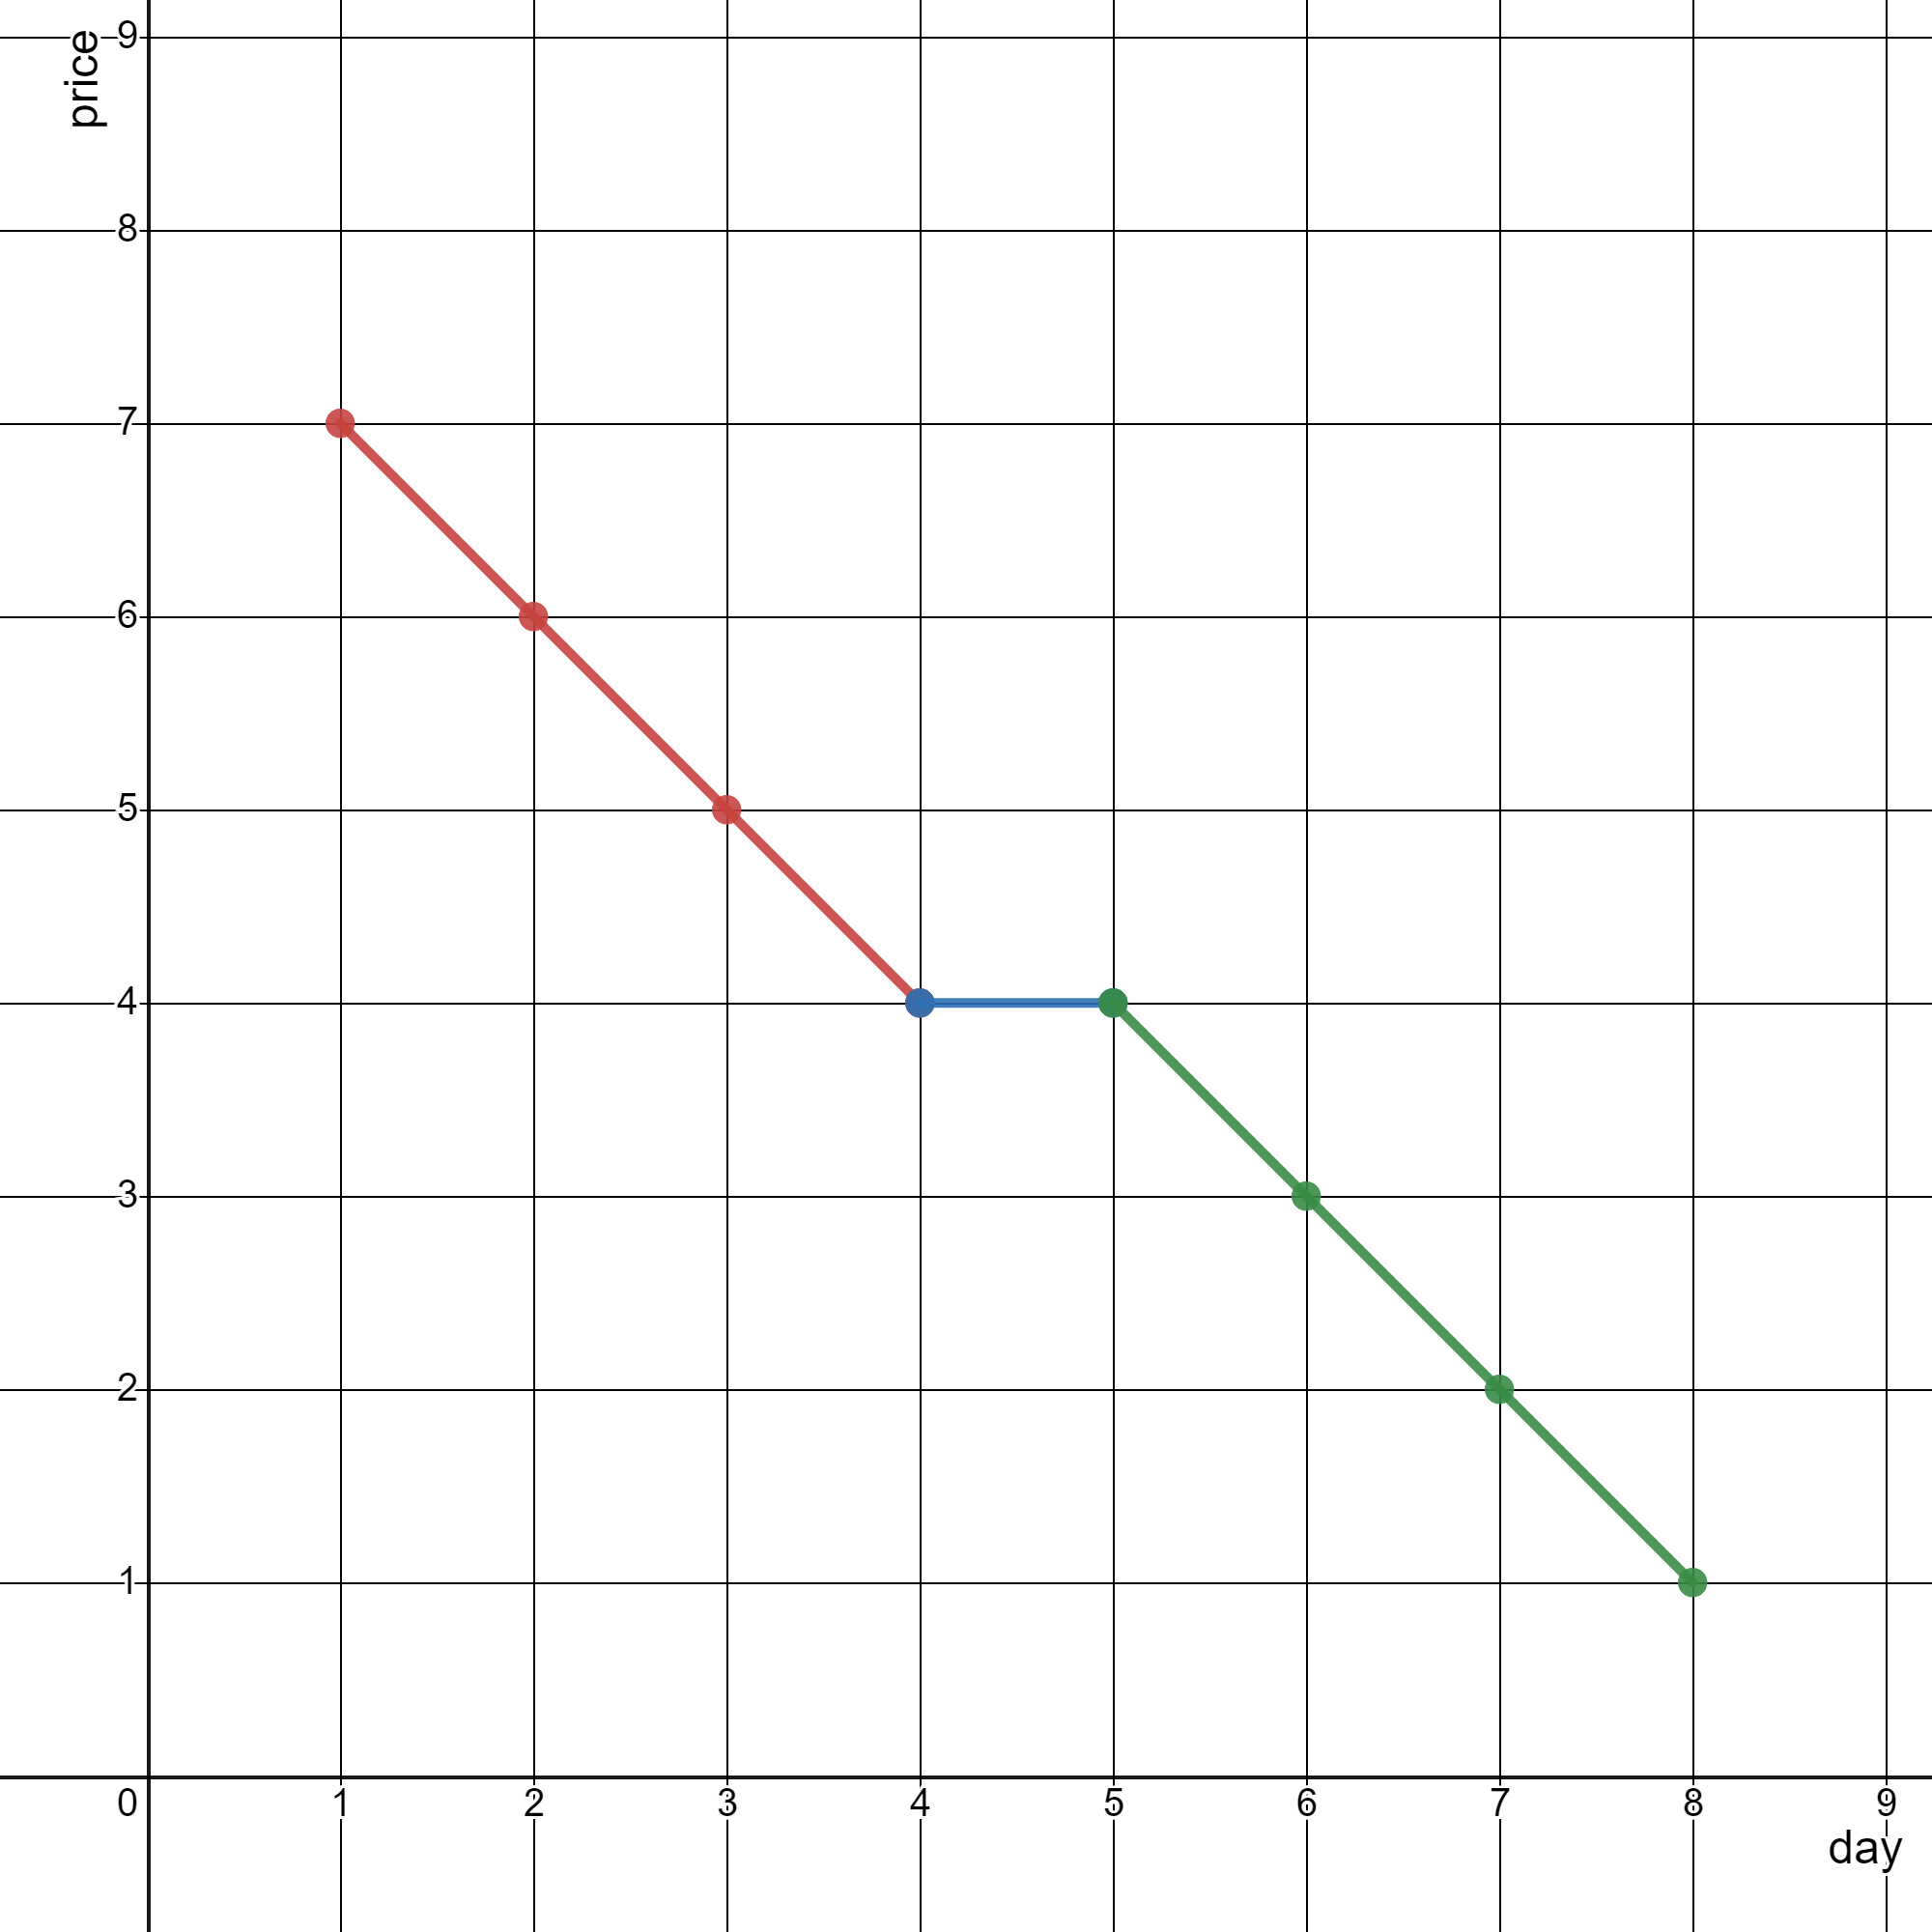
Input: stockPrices = [[1,7],[2,6],[3,5],[4,4],[5,4],[6,3],[7,2],[8,1]]
Output: 3
Explanation:
The diagram above represents the input, with the X-axis representing the day and Y-axis representing the price.
The following 3 lines can be drawn to represent the line chart:
- Line 1 (in red) from (1,7) to (4,4) passing through (1,7), (2,6), (3,5), and (4,4).
- Line 2 (in blue) from (4,4) to (5,4).
- Line 3 (in green) from (5,4) to (8,1) passing through (5,4), (6,3), (7,2), and (8,1).
It can be shown that it is not possible to represent the line chart using less than 3 lines.
Example 2:
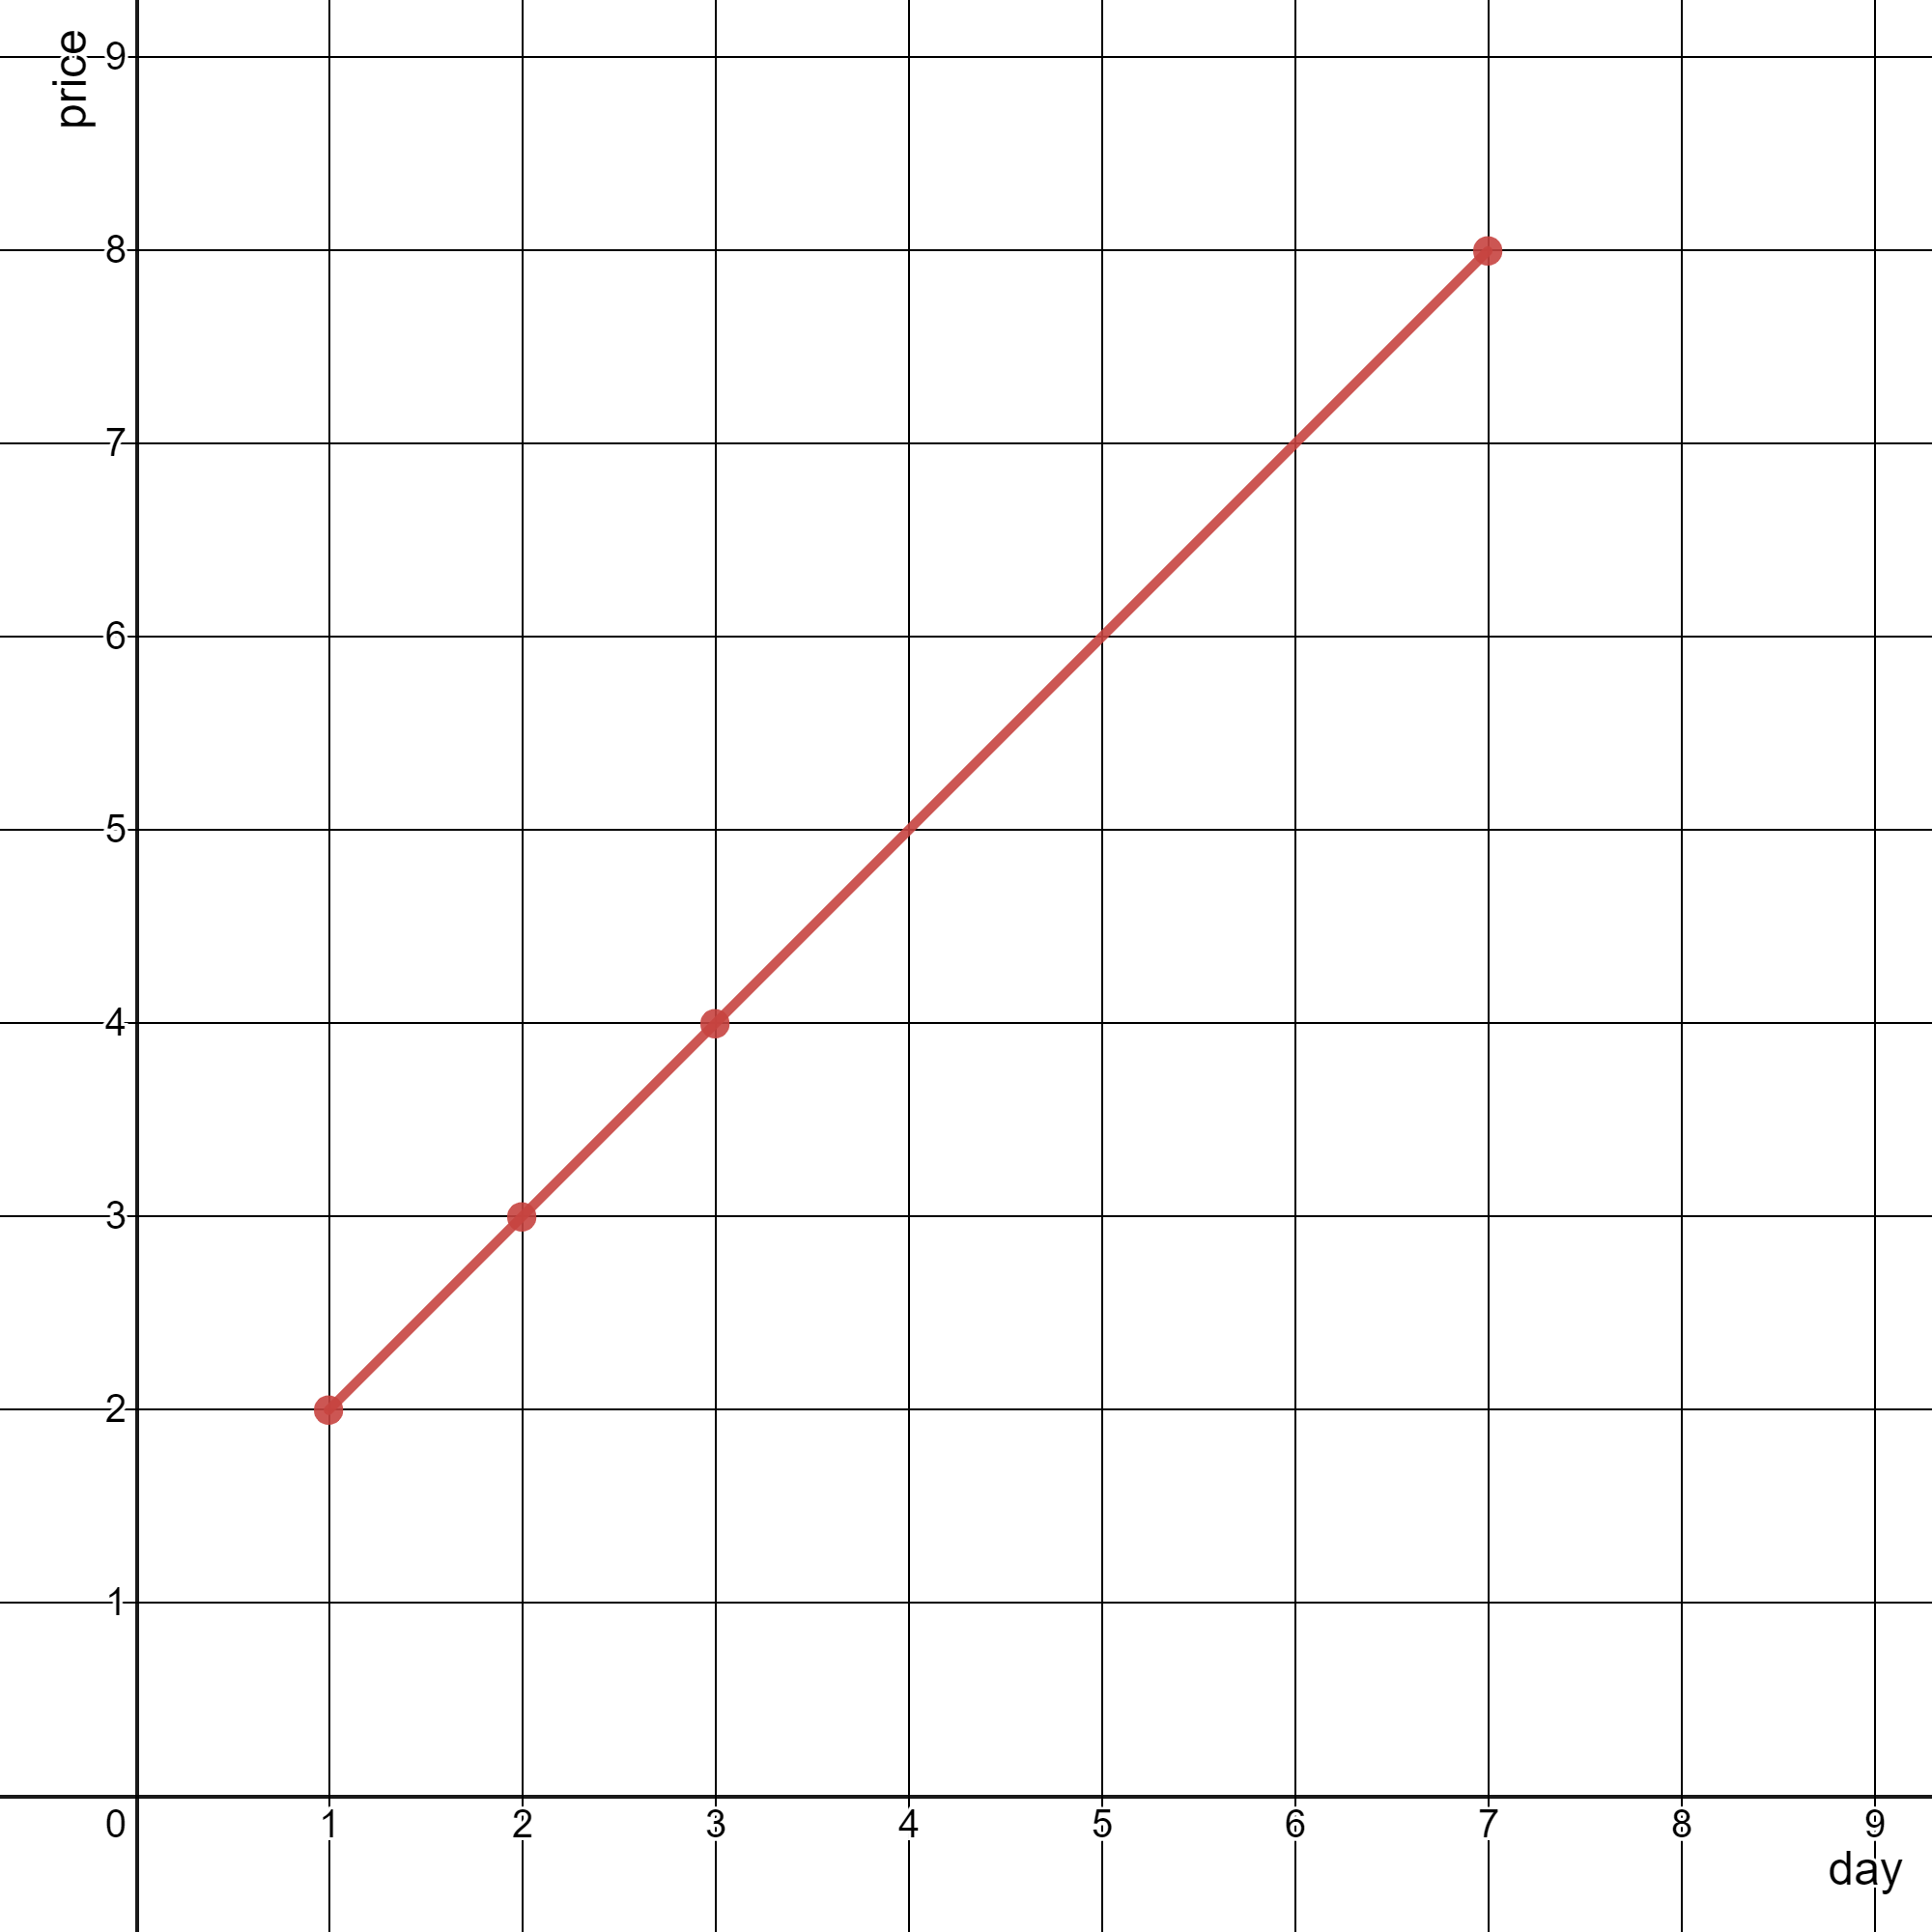
Input: stockPrices = [[3,4],[1,2],[7,8],[2,3]]
Output: 1
Explanation:
As shown in the diagram above, the line chart can be represented with a single line.
Constraints:
1 <= stockPrices.length <= 105stockPrices[i].length == 21 <= dayi, pricei <= 109- All
dayi are distinct.
Solutions
Solution 1
PythonJavaC++GoTypeScript
class Solution:
def minimumLines(self, stockPrices: List[List[int]]) -> int:
stockPrices.sort()
dx, dy = 0, 1
ans = 0
for (x, y), (x1, y1) in pairwise(stockPrices):
dx1, dy1 = x1 - x, y1 - y
if dy * dx1 != dx * dy1:
ans += 1
dx, dy = dx1, dy1
return ans(code-box)
class Solution {
public int minimumLines(int[][] stockPrices) {
Arrays.sort(stockPrices, (a, b) -> a[0] - b[0]);
int dx = 0, dy = 1;
int ans = 0;
for (int i = 1; i < stockPrices.length; ++i) {
int x = stockPrices[i - 1][0], y = stockPrices[i - 1][1];
int x1 = stockPrices[i][0], y1 = stockPrices[i][1];
int dx1 = x1 - x, dy1 = y1 - y;
if (dy * dx1 != dx * dy1) {
++ans;
}
dx = dx1;
dy = dy1;
}
return ans;
}
}(code-box)
class Solution {
public:
int minimumLines(vector<vector<int>>& stockPrices) {
sort(stockPrices.begin(), stockPrices.end());
int dx = 0, dy = 1;
int ans = 0;
for (int i = 1; i < stockPrices.size(); ++i) {
int x = stockPrices[i - 1][0], y = stockPrices[i - 1][1];
int x1 = stockPrices[i][0], y1 = stockPrices[i][1];
int dx1 = x1 - x, dy1 = y1 - y;
if ((long long) dy * dx1 != (long long) dx * dy1) ++ans;
dx = dx1;
dy = dy1;
}
return ans;
}
};(code-box)
func minimumLines(stockPrices [][]int) int {
ans := 0
sort.Slice(stockPrices, func(i, j int) bool { return stockPrices[i][0] < stockPrices[j][0] })
for i, dx, dy := 1, 0, 1; i < len(stockPrices); i++ {
x, y := stockPrices[i-1][0], stockPrices[i-1][1]
x1, y1 := stockPrices[i][0], stockPrices[i][1]
dx1, dy1 := x1-x, y1-y
if dy*dx1 != dx*dy1 {
ans++
}
dx, dy = dx1, dy1
}
return ans
}(code-box)
function minimumLines(stockPrices: number[][]): number {
const n = stockPrices.length;
stockPrices.sort((a, b) => a[0] - b[0]);
let ans = 0;
let pre = [BigInt(0), BigInt(0)];
for (let i = 1; i < n; i++) {
const [x1, y1] = stockPrices[i - 1];
const [x2, y2] = stockPrices[i];
const dx = BigInt(x2 - x1),
dy = BigInt(y2 - y1);
if (i == 1 || dx * pre[1] !== dy * pre[0]) ans++;
pre = [dx, dy];
}
return ans;
}(code-box)


